Assurance readiness
of the transition plan
and Scope 3 inventory
11 September 2026
Fifty-seven per cent of this inventory is ready. It carries 0.6 per cent of the tonnes.
Beckworth asked whether its FY2026 transition plan disclosures and greenhouse gas inventory would withstand a limited assurance engagement. Our answer is below, ahead of the evidence for it.
Both of those coverage figures are true and they describe the same inventory. Counting line items, Beckworth is most of the way to an assurable position. Counting tonnes, it has barely started. Any coverage statistic quoted by category count will flatter a coverage statistic quoted by tonnes, because the arithmetic of a value chain inventory puts almost all of the emissions in the numbers that are hardest to evidence. We recommend the committee ask for both figures every time it is given either.
Contents
This report is ordered by what we could sign. Sections 2, 3 and 4 are the three verdicts in turn, heaviest evidence first and heaviest tonnage last.
ready
Eight line items. Evidence exists, the method is documented, samples trace to source.
remediable
Five line items. The method holds and the evidence is incomplete. Section 6 closes it.
unavailable
One line item. No action inside the year produces sufficient evidence.
Basis, scope and what we did not do
A readiness assessment. It carries no conclusion on the disclosures themselves, and it is the document that tells you whether asking for one would be worth the fee.
What we did
We walked the preparation process for all fourteen reported line items with the group reporting team and with controllers at four sites. We reperformed 22 of the 41 calculation steps in the FY2026 inventory and traced 96 sample items to source evidence: meter reads, carrier manifests, purchase ledger entries and supplier declarations. We read the transition plan against the five public claims made in the FY2026 annual report, and we visited two of the four manufacturing sites.
What we did not do
We did not test the emission factors published by third parties, and we express no view on their suitability. We did not audit the category 11 model, and section 4 explains why testing it would have produced no useful evidence this year. We formed no view on whether any target will be met. Nothing in this report is an assurance conclusion under ISAE 3000 (Revised) or ISAE 3410.
engagement
Three things we should say about our own work
one
In our FY2025 note we assessed category 4 as ready. On retesting we found carrier data covering 63 per cent of movements against the 94 per cent reported to us. The error was ours. We tested the tonne-kilometre calculation and never tested the completeness of the movements feeding it. Page 20 sets out the restatement.
two
A limited assurance engagement is substantially less in scope than a reasonable assurance engagement. The conclusion it produces is negatively worded: it reports that nothing came to our attention. A reader who treats it as a positive opinion has taken more from it than it carries.
three
Where we call a figure ready, we mean it can be evidenced as prepared. That is a different question from whether it describes the world well. Page 14 sets out a Scope 2 figure which is ready and misleading at the same time, and we would sign it.
How to read this report
Three verdicts, applied to every line item in the inventory, and two honest ways of counting how much of it they cover.

Evidence exists, the method is documented, we reperformed the calculation and traced samples to source. A limited assurance conclusion is available on this line item now.
The method holds and the evidence is incomplete. Named actions with named owners close the gap. A conclusion becomes available if they are finished by 31 December 2026.
No action available inside the year produces evidence sufficient for a conclusion at any level of assurance. One line item sits here and section 4 is about it.
Two ways to count the same coverage
Both bars describe the same fourteen line items. The first counts them. The second weighs them. A management report that gives you one without the other is telling you half of something.
The inventory as it stands
What Beckworth reports, how each figure is made, and where the tonnage actually sits. This section reaches no verdicts: it is the ground the next three stand on.
The footprint, at a glance
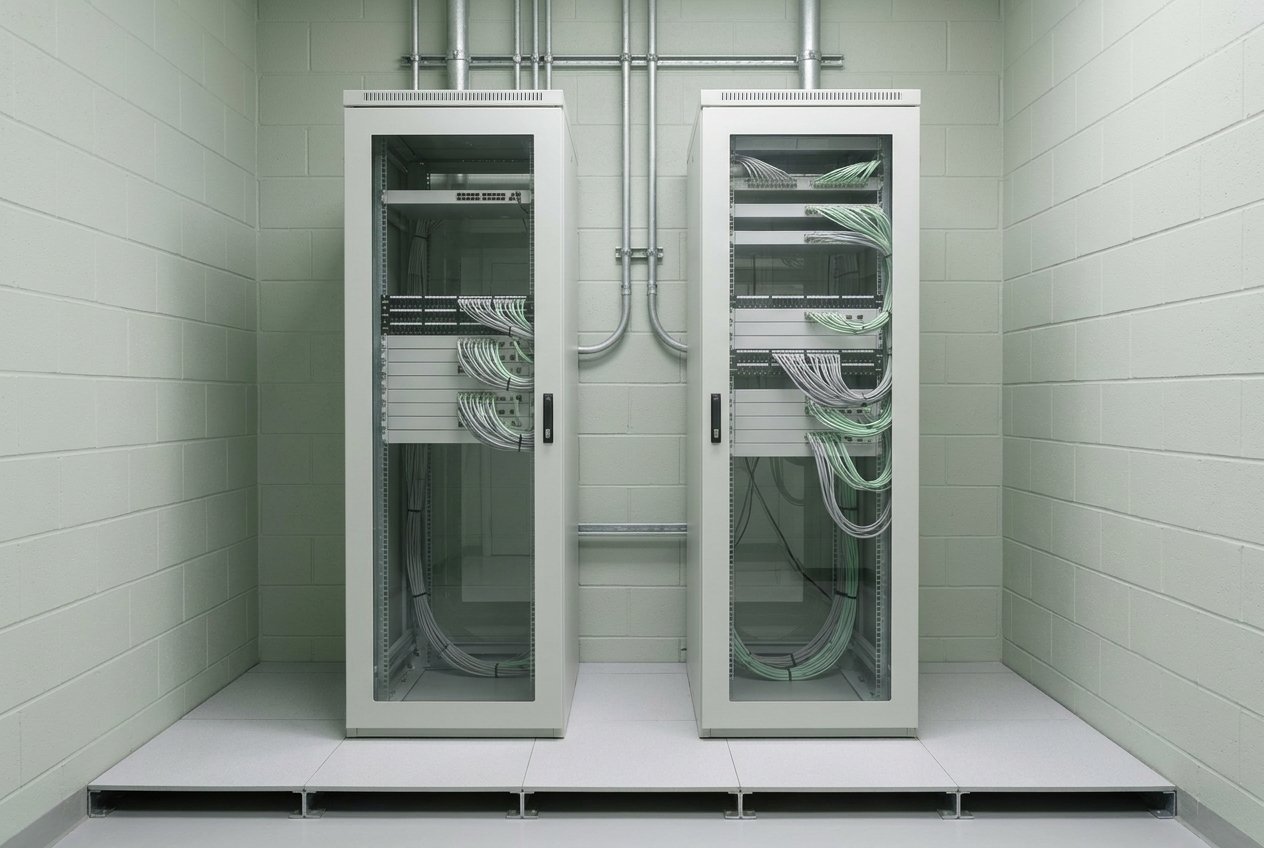
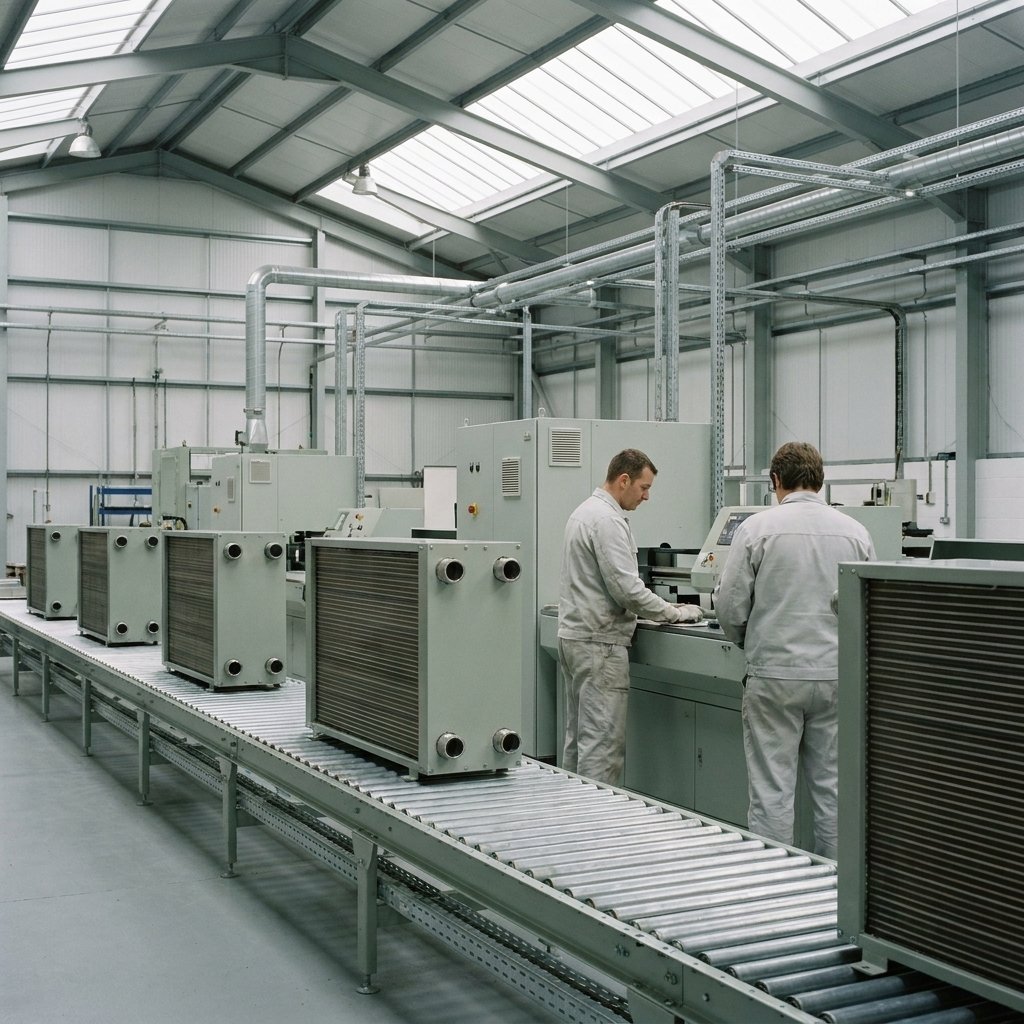
A manufacturer of domestic and commercial heating and hot water systems, whose own operations are a rounding error against what its products burn after they are sold.
| reported line | basis | tCO2e | share |
|---|---|---|---|
| Scope 1 · combustion, process and fleet | metered and invoiced | 18,400 | 0.2% |
| Scope 2 · purchased electricity, market-based | supplier contracts | 4,100 | 0.0% |
| Scope 2 · purchased electricity, location-based | grid average, memorandum | 9,700 | — |
| Scope 3 · twelve reported categories | mixed, see page 9 | 8,936,900 | 99.7% |
| Group footprint, Scope 1 + 2 (market) + 3 | 8,959,400 | 100% |
The shape of it
Beckworth manufactures in four plants and sells through merchants and an accredited installer network. Its own combustion, its electricity and everything it buys account for 9.4 per cent of the footprint it reports. The remaining 90.6 per cent is the gas and electricity that appliances already sold will consume over the years ahead, in houses the group has never visited and cannot meter.
That is the ordinary shape of a heating manufacturer's inventory and it is the reason this report is arranged the way it is. Assurance effort follows evidence, and evidence is thickest where the tonnes are thinnest.
intensity
The Scope 3 register
All fifteen categories, the method behind each figure, the record it is built from, and the verdict this report reaches on it.
| cat | category | tCO2e | method | record relied on | verdict |
|---|---|---|---|---|---|
| 01 | Purchased goods and services | 612,000 | spend-based 71%, average-data 29% | purchase ledger | |
| 02 | Capital goods | 41,300 | spend-based | fixed asset register | |
| 03 | Fuel and energy related activities | 6,900 | average-data | metered consumption | |
| 04 | Upstream transport and distribution | 78,400 | distance-based | carrier manifests | |
| 05 | Waste generated in operations | 3,200 | waste-type | contractor returns | |
| 06 | Business travel | 4,700 | distance-based | travel agency extract | |
| 07 | Employee commuting | 9,100 | survey and average-data | 2026 staff survey | |
| 08 | Upstream leased assets | 1,800 | average-data | lease schedule | |
| 09 | Downstream transport and distribution | 22,600 | distance-based | merchant delivery data | |
| 10 | Processing of sold products | n/a | appliances ship finished | none | |
| 11 | Use of sold products | 8,120,000 | modelled, 15-year assumed life | product registration data | |
| 12 | End of life treatment of sold products | 34,500 | average-data | national recovery rates | |
| 13 | Downstream leased assets | n/a | no leased assets downstream | none | |
| 14 | Franchises | n/a | no franchise arrangements | none | |
| 15 | Investments | 2,400 | investment-specific | joint venture accounts | |
| Total Scope 3 | 8,936,900 |
on the three exclusions
Categories 10, 13 and 14 carry no activity for this group and we agree with their exclusion. Each is disclosed as excluded with a reason, which is the disclosure the standard asks for.
on the mixed methods in category 1
A single category built from two methods needs both to be disclosed with the split. Beckworth discloses the split in a footnote and it should sit in the table.
on the one row we cannot sign
Category 11 is the only line in the register whose record is an assumption set rather than a transaction. Section 4 is entirely about it.
Where the tonnage sits
One category is nine tenths of the inventory. The other eleven, and both of the operational scopes, share what is left.
Read the two bars together and the assurance problem states itself. Almost all of the evidence a preparer can hold in its hands describes the lower bar. The upper bar is where the emissions are.
What changed since FY2025
Operational emissions fell. The group footprint rose. Both statements are true and a reader given only one of them has been misled.
| reported line | FY2025 as reported | restatement | FY2025 restated | FY2026 | change |
|---|---|---|---|---|---|
| Scope 1 | 19,100 | — | 19,100 | 18,400 | −3.7% |
| Scope 2, market-based | 5,300 | — | 5,300 | 4,100 | −22.6% |
| Scope 3 | 8,662,000 | +23,600 | 8,685,600 | 8,936,900 | +2.9% |
| Group footprint | 8,686,400 | +23,600 | 8,710,000 | 8,959,400 | +2.9% |
Why the two directions
Scope 1 and Scope 2 together fell 7.8 per cent, from 24,400 to 22,500 tCO2e, on a full year of the Poland site's contracted renewable supply and a smaller fleet. That is a real reduction and Beckworth is entitled to report it.
Over the same year unit sales rose 4.6 per cent, from 1,185,000 to 1,240,000 appliances. Category 11 scales almost directly with units sold, so the group footprint rose 2.9 per cent while the part of it management controls fell. Intensity per appliance fell 1.6 per cent, from 7.33 to 7.21 tCO2e.
Three of those four figures appear in the FY2026 annual report. The group footprint movement appears in a footnote to the basis of preparation, eleven pages after the headline reduction is stated.
the restatement, and whose it is
Category 4 for FY2025 was reported at 51,300 tCO2e and is restated to 74,900, an increase of 23,600 tonnes, or 46 per cent.
Carrier data supplied to the calculation covered 63 per cent of movements. The completeness figure given to us, and to the preparer, was 94 per cent. We accepted it without testing it. Page 20 sets out how the error arose and what we changed in our own approach.
Scaled by percentage the reduction looks like the larger of the two. Scaled by tonnes, which is what reaches the atmosphere, the reduction is the tick on the upper line.
We recommend the group footprint movement and the operational movement be given equal prominence wherever either is disclosed, and that the intensity metric carry its denominator on the same line. An assurance conclusion covers the figures. It does not cover which of them a reader finds first.
What we can sign today
Eight line items where evidence exists, the method is documented, and samples trace to source. Together they are 50,600 tCO2e, which is 0.6 per cent of what Beckworth reports.
Scope 1: metered gas, process and the fleet
The cleanest number in the inventory. Four sites, forty eight meters, supplier invoices behind every one of them.
| source | evidence relied on | tCO2e | tested |
|---|---|---|---|
| Natural gas combustion, four sites | meter reads reconciled to supplier invoices | 12,900 | 24 of 48 |
| Fleet, 310 vehicles | fuel card transaction data | 3,600 | full year |
| Process emissions, brazing and test | gas purchase records | 1,400 | 4 of 4 |
| Refrigerant losses | service and recharge records | 500 | all sites |
| Scope 1 | 18,400 |
Two findings, both minor
Gas consumed by the development laboratory's test rigs is metered at site level and allocated to the laboratory by floor area. The allocation is around 220 tCO2e and the basis is undisclosed. We would ask for a sub-meter before FY2028, and for the allocation basis to be stated meanwhile.
Refrigerant losses use a default annual leak rate of 6 per cent. Service records across the four sites show 4.1 per cent. The default overstates the figure, so we raise it as a disclosure point rather than an error.
Why this line is ready
Every figure here begins as a transaction with a counterparty: a gas invoice, a fuel card entry, a refrigerant purchase. Each one is recorded twice, once by Beckworth and once by someone with an interest in it being right, and the two records can be brought together. That is the whole basis on which we are able to reach a conclusion.
Nothing in section 4 has that property, which is why section 4 exists.
samples traced
32 of the 96 traced across the engagement sit on this line. All 32 agreed to source.
steps reperformed
Nine of the 22 calculation steps we reperformed are Scope 1. All nine agreed.
verdict
Scope 2: a figure that is ready and misleading
Prepared correctly, evidenced fully, and capable of leaving a reader with the wrong impression. We would sign it, and we want the committee to understand it first.
| Scope 2, 38,400 MWh across four sites | tCO2e |
|---|---|
| Location-based, grid average factors | 9,700 |
| Market-based, as reported | 4,100 |
| Difference | 5,600 |
The difference is closed by unbundled energy attribute certificates covering 71 per cent of consumption. Beckworth holds the certificates, they are retired against the reporting year, and we traced all of them. Under the Scope 2 Guidance the market-based figure is prepared as the standard requires and we are able to reach a conclusion on it.
Three of the four sites draw power in markets where generation and consumption diverge across the day. The certificates are annual instruments matched to annual consumption. On an hourly matching basis the reported figure would rise, and on our reading of the site load profiles it would rise materially.
what we tested
the distinction this page exists to draw
The six small categories
Together 28,100 tCO2e, which is 0.3 per cent of the footprint. They took an estimated two fifths of the reporting team's preparation time this year.
| cat | category | tCO2e | evidence and what we did | verdict |
|---|---|---|---|---|
| 03 | Fuel and energy related | 6,900 | Derived from the same metered consumption as Scope 1 and 2. Reperformed in full. | |
| 05 | Waste in operations | 3,200 | Contractor weight returns for all four sites. Twelve of 48 monthly returns traced. | |
| 06 | Business travel | 4,700 | Agency extract covering 94 per cent of spend. The balance is expensed mileage, estimated. | |
| 07 | Employee commuting | 9,100 | Staff survey, 34 per cent response, grossed to headcount. See the caveat below. | |
| 08 | Upstream leased assets | 1,800 | Three leased depots. Floor area and average-data factors. Reperformed in full. | |
| 15 | Investments | 2,400 | One joint venture at 40 per cent. Share of its own reported Scope 1 and 2. | |
| Six categories | 28,100 |
The caveat on category 7
Employee commuting rests on a survey with a 34 per cent response rate, grossed to 6,900 employees. A response rate at that level carries a real risk that the people who answered travel differently from the people who did. We accept it for limited assurance, because the category is 0.1 per cent of the footprint and the method is disclosed. It would fail a reasonable assurance test and Beckworth should know that before it commits to raising the level.
Where the effort goes
These six categories are the ones a preparation team can finish. They have owners, they have deadlines, and each one ends in a number that can be checked. Category 11 has none of those properties, so it gets modelled once a year and set aside.
We raise it because effort follows tractability rather than materiality, and nobody decides to let that happen.
What we can sign after the work
Five line items, 788,800 tCO2e, and every one of them turns on getting data out of somebody else's business.
Category 1, and the spend-based problem
612,000 tCO2e, which is 77.6 per cent of the remediable tonnage. Most of it is calculated from money rather than from anything physical.
| how category 1 is built | tCO2e | share |
|---|---|---|
| Spend-based, environmentally extended input-output factors | 434,500 | 71% |
| Supplier-specific and average-data | 177,500 | 29% |
| Category 1 | 612,000 | 100% |
A spend-based figure multiplies money by an industry-average intensity. It responds to purchase prices, to supplier mix, and to how the ledger is coded. It responds only faintly to anything Beckworth's suppliers actually do.
The consequence is worth stating plainly. A 5 per cent fall in purchase prices across the spend-based portion, with tonnage and supplier behaviour unchanged, would reduce reported category 1 emissions by about 21,725 tCO2e. Procurement would have decarbonised nothing and the disclosure would improve.
the spend behind it
Three of the 28 purchase ledger lines we sampled were coded to a commodity class that carries a materially different intensity. Two were steel pressings coded as general fabricated metal. In a spend-based method the ledger coding is the emission factor selection, and it is performed by people who have never been told that.
The dark portion of that bar is the part of category 1 that would respond to a supplier changing what it does. The rest responds to what Beckworth pays, and the transition plan's supplier engagement work is aimed almost entirely at the smaller piece.
why this is B and not A
The method is permitted, disclosed and consistently applied, and we could form a conclusion on arithmetic alone. We are unwilling to, because the ledger coding that drives it has no control over it. A control over commodity coding, and supplier-specific data for the largest suppliers, moves this line to A.
what we would need
A documented coding control with a second reviewer on classes above £2m of spend, verified product footprints for the top 34 suppliers, and the method split disclosed in the table rather than in a footnote. Page 18 sets out the supplier half of that.
Thirty-four suppliers, and what to ask them for
2,840 suppliers, of which 34 suppliers carry 62 per cent of the spend. The whole of the category 1 remediation sits inside that number.
Spend-based coverage is 71 per cent today. The top 34 suppliers account for 45 percentage points of it, so moving them to verified supplier-specific data takes spend-based coverage to 26 per cent.
| count | what the supplier has today | what Beckworth has to do | by |
|---|---|---|---|
| 11 | A third-party verified product carbon footprint, published | Collect it, check the verification statement covers the products actually bought, map to the purchase ledger. | 31 Oct 26 |
| 9 | An unverified figure, available on request | Request it, obtain the calculation basis, and treat it as average-data until it is verified. | 30 Nov 26 |
| 14 | Nothing | Contract clause at next renewal, plus a data request supported by the category manager. Expect two years. | FY2028 |
| 34 | suppliers, 62 per cent of purchased goods spend |
A warning about supplier data
Supplier-specific data is better evidence only when it is better evidence. A figure produced by a supplier's own spreadsheet, unverified and unexplained, is a spend-based estimate with somebody else's name on it, and it carries the additional problem that Beckworth cannot test it.
We recommend a rule the reporting team can apply without judgement: accept a supplier figure into the inventory when it carries third-party verification, and use average-data in every other case. The nine suppliers in the middle row will produce numbers that look authoritative, and the rule is what stops them being treated as such.
What it costs
The transition plan allocates £12m to the supplier data programme, against £340m of total transition capital. That is the line of the capital programme this report depends on most, and page 31 sets out how it compares with the rest.
We make no comment on whether £12m is the right figure. We do observe that the eleven actions in section 6 are almost entirely staffed from it.
Categories 2, 4, 9 and 12
176,800 tCO2e between them. Each one fails on completeness of the population rather than on the arithmetic performed over it.
| cat | category | tCO2e | the gap | what closes it |
|---|---|---|---|---|
| 04 | Upstream transport | 78,400 | Carrier data covers 63 per cent of movements. Inbound collections arranged by suppliers are outside the carrier feed entirely. | Extend the feed to the four nominated carriers and estimate supplier-arranged movements from goods receipt records. |
| 02 | Capital goods | 41,300 | Spend-based over the fixed asset additions register. Two of the four sites capitalise differently, so the population is inconsistent. | A single capitalisation policy applied for reporting, and spend-based factors selected by asset class. |
| 12 | End of life | 34,500 | National average recovery rates applied to units sold fifteen years earlier. The unit count for those years is reconstructed. | Reconstruct the historic unit series from the product registration database and document the reconstruction. |
| 09 | Downstream transport | 22,600 | Merchant delivery data for two of five merchant groups. The other three are estimated from pallet counts. | Data sharing clause in the three merchant agreements due for renewal in FY2027. |
| Four categories | 176,800 |
The pattern across all four
In every one of these categories the calculation is competent and the population it runs over is incomplete. That is the harder defect to see, because a calculation can be reperformed and a missing population announces nothing. It is also the defect that produced our own error on category 4, which the next page sets out.
completeness, measured
Our own error, and its restatement
In FY2025 we told this committee that category 4 was ready. It was wrong, the reason it was wrong is instructive, and it has changed how we scope this kind of engagement.
| FY2025 engagement | what happened |
|---|---|
| What we tested | The tonne-kilometre calculation applied to the carrier data file. Fourteen movements traced to carrier manifests. All fourteen agreed. |
| What we relied on | A management representation that the carrier file covered 94 per cent of inbound and outbound movements. |
| What we did not do | Test that representation. We had no procedure that would have found the movements missing from the file, because we never established what the population was. |
| What is the case | The file covers 63 per cent of movements. Inbound collections arranged by suppliers on their own carriers never entered it. |
| Effect | FY2025 category 4 restated from 51,300 to 74,900 tCO2e, an increase of 23,600 tonnes, or 46 per cent. Category 4 moves from verdict A to verdict B. |
How it happened
We treated a completeness assertion as evidence. It arrived in a representation letter, it was specific, it came from people who had no reason to mislead us, and none of that makes it evidence. This is the oldest failure in our trade and it remains the commonest, because a completeness gap produces no exception, no reconciling item and no failed sample. Everything you test agrees, and everything you tested came from the same incomplete file.
What we changed
We now establish the population before performing any procedure over it, and we treat a completeness assertion from management as a hypothesis to be tested. On this engagement that change is what found the category 9 coverage of two merchant groups out of five, and the inconsistent capitalisation behind category 2. Both had been in place in FY2025 and neither was reported.
What has to be in place by 31 December
Seven actions. Together they move 788,800 tCO2e from verdict B to verdict A, and they are the whole of the difference between a 0.6 per cent conclusion and a 9.4 per cent one.
| ref | action | owner | date | line |
|---|---|---|---|---|
| B1 | Extend the carrier data feed to all four nominated carriers | Logistics Director | 31 Oct 26 | cat 4 |
| B2 | Estimate supplier-arranged inbound movements from goods receipt records, and document the basis | Group Reporting Manager | 30 Nov 26 | cat 4 |
| B3 | Collect and map the verified footprints published by 11 of the top suppliers | Head of Procurement | 31 Oct 26 | cat 1 |
| B4 | Request figures from the 9 suppliers holding unverified data, and record them as average-data until verified | Category Manager, Metals | 30 Nov 26 | cat 1 |
| B5 | Introduce a second-reviewer control over commodity coding above £2m of spend | Group Financial Controller | 31 Oct 26 | cat 1 |
| B6 | Apply one capitalisation policy across the four sites for reporting | Group Financial Controller | 30 Nov 26 | cat 2 |
| B7 | Reconstruct the historic unit series from the product registration database, and document it | Head of Sustainability | 15 Dec 26 | cat 12 |
On the timetable
Five of the seven fall on two owners. The Group Financial Controller carries B5 and B6 alongside the FY2027 interim close, and both are due inside the same fortnight. We raise it because the timetable has no float and because the FY2027 reporting date moves for nobody.
what the seven are worth
What we cannot sign
One line item, 8,120,000 tCO2e, 90.6 per cent of the group footprint. Nothing available inside this year changes its status.
Category 11: the number and the model behind it
Every other line in this inventory begins with a transaction. This one begins with an assumption about how 1,240,000 households will behave for the next fifteen years.
How the figure is made
Beckworth takes the appliances it sold in the year, assigns each a fuel and a rated output from the product registration database, assumes an annual heat demand and an appliance life, and multiplies through by the emission factor for the fuel across the assumed life. The result is recognised in full in the year of sale, which is what the standard requires.
The database is good. It is the one part of this calculation with a real record behind it, and we traced 22 sample units through it without exception. Everything applied to those units afterwards is an assumption, and four of them carry the figure.
Why we cannot reach a conclusion
A limited assurance conclusion requires evidence sufficient to say that nothing has come to our attention suggesting the figure is materially misstated. Materiality on this inventory is around 90,000 tCO2e. The assumption set moves the figure by millions. There is no procedure we could perform, at any cost, that would let us make that statement honestly for FY2026.
the calculation
materiality
Around 90,000 tCO2e, at 1 per cent of the group footprint. Every one of the four assumptions on page 26 moves category 11 by more than ten times that.
the distinction that decides this section
The range, and what it is wider than
Beckworth's own scenario analysis puts category 11 between 5,240,000 and 11,760,000 tCO2e. That band is 6,520,000 tonnes wide.
What that comparison means
The uncertainty band on the single figure we cannot sign is nearly eight times the size of everything in the inventory we can. Beckworth could measure every other line perfectly, and the total would still be governed by which end of that band the world turns out to be at.
This is the argument for reporting category 11 as a range with its central estimate, which Beckworth does in the basis of preparation. It is also the argument for stopping any presentation that adds category 11 to the operational scopes and offers the sum as a single tonne figure without the band beside it.
Where the band comes from
The low and high cases move all four principal assumptions to their bounds together. They are Beckworth's own bounds, taken from its FY2026 sensitivity work, and we regard them as reasonable rather than conservative: an eighteen-year appliance life is ordinary in the installed base, and a twelve-year life is what the warranty and replacement data actually support.
Page 26 moves each assumption on its own, which is the more useful view for anyone deciding where to spend effort.
Materiality, for scale
Materiality on this inventory is around 90,000 tCO2e. The category 11 band is roughly seventy-two times that. A limited assurance conclusion asks whether anything has come to our attention suggesting a material misstatement, and on this line the honest position is that the question cannot be reached: the estimate's own range sits two orders of magnitude beyond the threshold the question is asked against.
Four assumptions, moved one at a time
Each bar holds the other three at their central value and moves one assumption to its bounds. The reported figure sits on the vertical rule.
12 to 18 years
10,300 to 12,500 kWh
fast to slow decarbonisation
gas, LPG, oil, electric
| assumption | low case | reported | high case | evidence behind it today |
|---|---|---|---|---|
| Appliance life | 6,496,000 | 8,120,000 | 9,744,000 | Warranty and replacement data, no field study |
| Annual heat demand | 7,336,000 | 8,120,000 | 8,904,000 | Published housing stock averages |
| Fuel factor trajectory | 7,470,000 | 8,120,000 | 8,650,000 | Third-party projections, updated annually |
| Fuel split of the base | 7,880,000 | 8,120,000 | 8,390,000 | Product registration database |
What we would measure first
Annual heat demand, ahead of appliance life. It moves the figure second furthest, it is the assumption a field study can settle inside two heating seasons, and it is the one where published housing stock averages are least likely to describe Beckworth's own installed base. Appliance life needs a decade of observation to improve on the warranty data, so it stays an assumption for the foreseeable future.
What the group already holds
Around 74,000 appliances sold since 2023 are connected to Beckworth's own controls app, and they report runtime. That is a sample nobody in the reporting team had considered as evidence, because it sits with the product organisation and has never been asked for. It would be the obvious starting population for action C2.
Only the fourth of these rests on a record Beckworth holds, and it is also the least significant. The two that move the figure furthest, appliance life and annual heat demand, are taken from published averages about a housing stock rather than from anything observed about Beckworth's own appliances in service.
What would make it assurable, and when
Two different statements can be made about category 11. One of them is available within a few years. The other is the one most readers assume they are being given.
statement one
Unavailable for FY2026 and unavailable for FY2027. It needs primary evidence for the assumptions that move the number, which means observing appliances in service. On the timetable below, FY2030 is the earliest credible date.
statement two
Available from FY2028 once the assumption set is governed and its changes are logged. It is worth considerably less than it sounds, and it is easily read as statement one by anyone who is moving quickly.
| year | what could carry a conclusion | what has to exist first |
|---|---|---|
| FY2027 | Nothing on category 11 | The assumption set is undocumented and ungoverned. A change to it in-year would leave no trail. |
| FY2028 | Statement two, consistent application | A governed assumption set with a named owner, a change log, and approval of changes above a defined threshold. |
| FY2030 | Statement one, at limited assurance | A completed field study of annual heat demand and appliance life, covering at least one full heating season and a representative sample. |
The two actions this section produces
C1 establishes the governed assumption set: one named owner, a change log, and board approval of any change moving the figure by more than materiality. It costs almost nothing and it is the gate on everything after it.
C2 commissions a field study of annual heat demand across a sample of 2,000 installed appliances across a full heating season. It replaces the single assumption that moves the number second furthest with a measurement. It is unfunded in the current capital programme, which page 31 returns to.
the recommendation we would press hardest
If Beckworth obtains assurance over statement two, the disclosure must say which statement is covered, in the same sentence as the assurance reference and in the same type size. A reader who sees a category 11 figure beside an assurance stamp will assume statement one. That assumption would be the group's responsibility to prevent.
The transition plan claims
Five statements Beckworth makes in public. A number can be assured. A claim has to be testable first, and two of these are written in a form that cannot be tested by anybody.
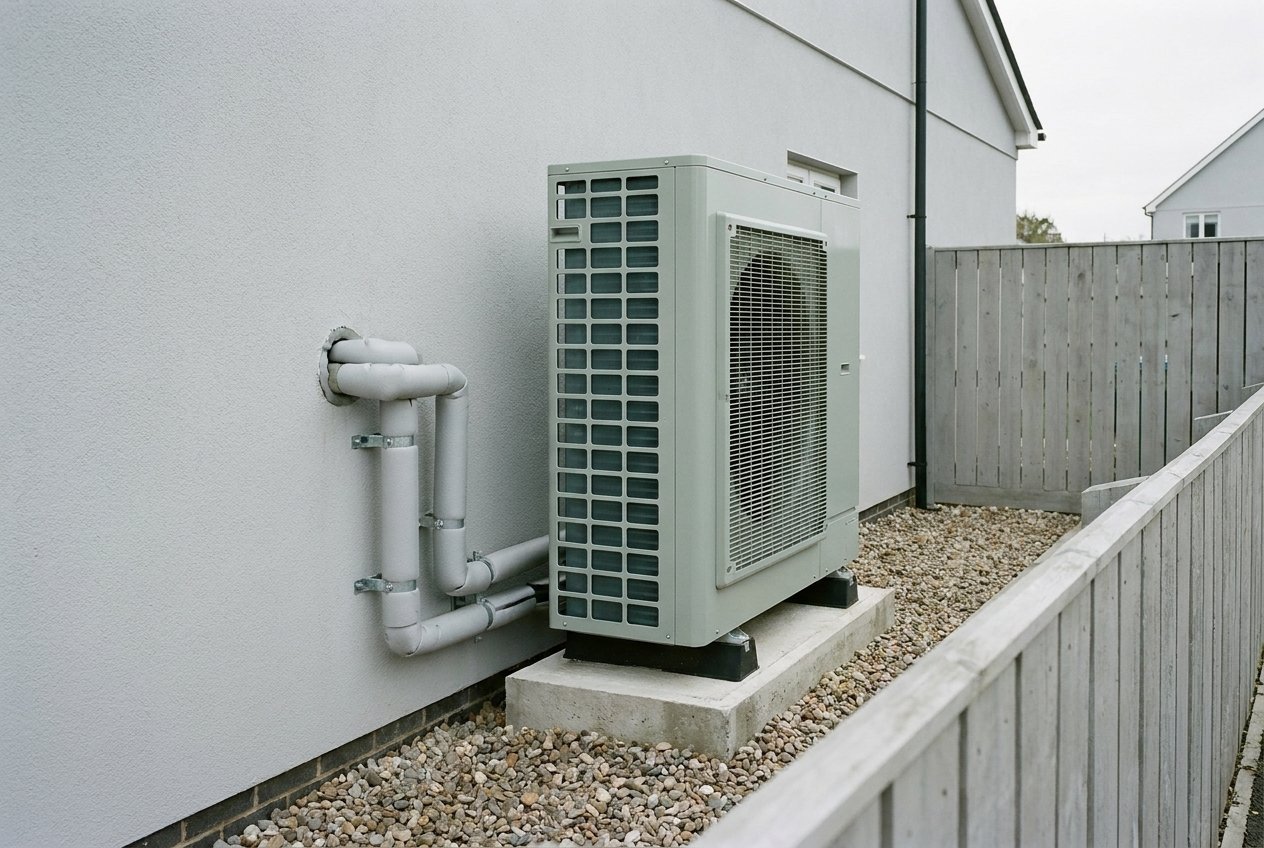
The five public claims
Taken from the FY2026 annual report and the transition plan as published. The wording is Beckworth's.
There is no value chain milestone between 2032 and 2045, residual emissions are undefined, and no neutralisation approach is stated. A commitment with a thirteen-year gap in it cannot be tested by us, by the board, or by an investor.
Base year 34,900 tCO2e, FY2026 22,500, a reduction of 35.5 per cent achieved against a target implying 20,242 by 2032. The base year is documented and the boundary has held.
The denominator changed in FY2024 when the commercial range was reclassified, and the 2022 base was restated once to match. The restatement is undisclosed. Base intensity is stated as 8.94 and FY2026 is 7.21.
It states an outcome the group does not control: it depends on what householders choose to install and on what installers are trained to fit. FY2026 is 19 per cent. Page 30 sets out what the claim would look like written as an action.
The five programme lines sum to £340m and each traces to an approved business case. Alignment itself is undefined: there is no tagging methodology and no stated test for what qualifies. Page 31 sets out the programme.
Three of the five would move to supported with a change of wording rather than a change of ambition. That is worth saying plainly, because a claim written as an action the group controls is both more defensible and more useful to a reader than the same ambition written as a result.
The 2032 product mix claim
A target expressed as a result the group does not control. It is the most prominent number in the transition plan and the one we can do least with.
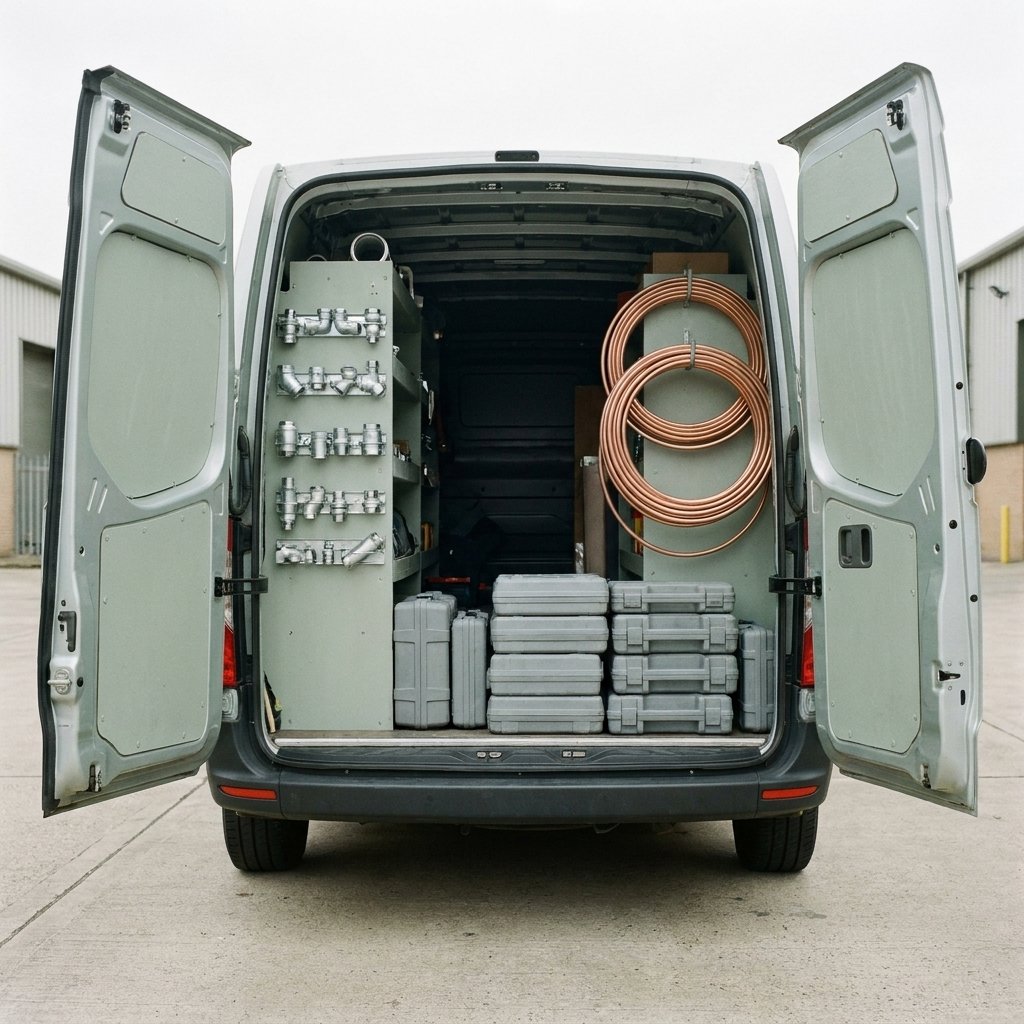
What the claim depends on
Three things have to happen, and Beckworth controls none of them outright. A householder has to choose a heat pump at the moment an existing appliance fails, which is usually in winter and usually urgent. The property has to suit one without work the householder will pay for. And an installer within reach has to be trained and willing to fit it.
The transition plan assumes 2,600 heat pump accredited installers by 2032, which is also 3.8 times today's 690. That assumption is the group's own to deliver, it is funded at £32m, and it is testable. It appears in the plan as supporting detail rather than as the commitment.
the same ambition, written as an action
Every element of that is inside the group's control, evidenced by a capacity plan and a training record, and capable of carrying an assurance conclusion. The 68 per cent then becomes what it actually is: a market assumption, disclosed as one.
what we would report today
On the claim as published, nothing. There is no evidence available in 2026 about unit sales in 2032, and a conclusion on a forward-looking target is outside the scope of any assurance engagement in any case.
what we could report on the restated form
Progress against capacity and accreditation, annually, at limited assurance, from FY2027. Both rest on records the group already keeps.
The capital programme
£340m to 2032. The five lines sum and each traces to an approved business case. What the programme does not fund is the point of this page.
| programme line | £m | share | what it buys |
|---|---|---|---|
| Product development, low carbon range | £186m | 54.7% | Two new heat pump platforms and a hydrogen-ready boiler range |
| Manufacturing conversion, two sites | £84m | 24.7% | Line conversion and tooling at the two UK plants |
| Installer training network | £32m | 9.4% | Training centres and accreditation for 2,600 installers |
| Digital measurement and reporting | £26m | 7.6% | Inventory systems, ledger coding controls, data governance |
| Supplier data programme | £12m | 3.5% | Supplier engagement, data collection, verification support |
| Transition capital to 2032 | £340m | 100% |
What the £38m does
It funds every one of the seven actions in section 3, and it is the reason we regard verdict B as genuinely remediable rather than aspirational. £38m against £340m is a serious commitment to measurement by the standards of this sector.
What it does not do
None of it reaches category 11. The field study at action C2, which would replace the assumption that moves 90.6 per cent of the footprint second furthest, has no line in this programme and no owner outside this report. It would cost a fraction of any line in the table above.
A note on how the programme reads against the inventory
Set the capital table beside page 10 and the two describe different companies. The programme is 79 per cent product and manufacturing, which is where Beckworth's own operations and its future product mix sit. The inventory is 90.6 per cent the fuel burnt by appliances already sold, which no line in the programme measures and only the product development line will eventually reduce. Both facts are reasonable on their own terms. Reported together, they are the clearest statement of the group's position we could put in front of the committee.
On the alignment claim itself: the five lines are plainly connected to the transition plan and we would expect any reasonable person to accept them. Alignment nonetheless needs a definition and a tagging methodology before it can be assured, because at present the claim rests on the reader agreeing with the group's judgement rather than on a test either of them could apply.
What has to happen
Eleven actions, each with an owner and a date. Seven of them move 788,800 tCO2e into a position we could sign. Two of them are about the 8,120,000 we could not.
Eleven actions, owners and dates
The complete register. We have set it out in the form we would use to track it, so that the committee can ask for the same table at each meeting.
| ref | action | owner | due | moves |
|---|---|---|---|---|
| B1 | Extend the carrier data feed to all four nominated carriers | Logistics Director | 31 Oct 26 | 78,400 |
| B2 | Estimate supplier-arranged inbound movements from goods receipt records | Group Reporting Manager | 30 Nov 26 | incl. |
| B3 | Collect and map the verified footprints published by 11 top suppliers | Head of Procurement | 31 Oct 26 | 612,000 |
| B4 | Request figures from the 9 suppliers holding unverified data | Category Manager, Metals | 30 Nov 26 | incl. |
| B5 | Second-reviewer control over commodity coding above £2m of spend | Group Financial Controller | 31 Oct 26 | incl. |
| B6 | One capitalisation policy across the four sites, for reporting | Group Financial Controller | 30 Nov 26 | 41,300 |
| B7 | Reconstruct the historic unit series from product registration data | Head of Sustainability | 15 Dec 26 | 34,500 |
| C1 | Governed assumption set for the category 11 model: named owner, change log, board approval above materiality | Head of Sustainability | 31 Mar 27 | gate |
| C2 | Field study of annual heat demand across 2,000 installed appliances, one full heating season | Product Director | 30 Sep 28 | unfunded |
| T1 | Restate the 68 per cent claim as capacity and accreditation, and disclose the market assumption separately | Head of Sustainability | FY27 report | claim |
| T2 | Disclose the 2022 base year restatement, and define alignment for the capital programme | Group Financial Controller | FY27 report | claim |
On ownership
Nine of the eleven sit with four people, and the Group Financial Controller holds three of them across the FY2027 interim close. We have said this once already and we repeat it here because an action register with no float in it is the ordinary way these programmes fail, quietly, in the fourth quarter.
the register in summary
The three that matter
If the committee presses on three of the eleven, these are the three. None of them is expensive, and two of them are a drafting decision and a governance decision rather than a programme.
It costs a policy, a spreadsheet and a standing agenda item. Until it exists nothing about 90.6 per cent of the footprint can ever be assured, and a change to the model in any year would leave no trail behind it. Everything in the FY2028 and FY2030 timetable depends on this one action starting now.
B2
This is the defect that produced our own error, and completeness gaps are the failure that repeats: they generate no exception and no failed sample. Closing it also gives the group a method it can apply to categories 9 and 12, where the same shape of gap is now visible.
A drafting session converts the most prominent number in the transition plan from something no one can test into something the group can be held to and we can report on annually. The ambition is unchanged. What changes is whether anybody can check it.
The route to a first opinion
| reporting | what could carry a conclusion | coverage | conditional on |
|---|---|---|---|
| FY2027, July 27 | Scope 1, Scope 2 and twelve Scope 3 categories, excluding category 11 | 9.4% | The seven B actions completing by 31 December 2026 |
| FY2028 | The above, plus consistent application of the category 11 model | 9.4% | C1, with a full year of the governed assumption set |
| FY2030 | The above, plus the category 11 figure itself | 100% | C2, funded in FY2027 and reporting by September 2028 |
Basis of preparation and standards
Standards referenced
| reference | used for |
|---|---|
| ISAE 3000 (Revised) | The form a limited assurance engagement would take, and the basis for the readiness criteria used throughout |
| ISAE 3410 | Greenhouse gas statements specifically, including materiality and the treatment of estimates |
| GHG Protocol Corporate Standard | Scope 1 and Scope 2 boundaries and the operational control approach |
| Corporate Value Chain (Scope 3) Standard | Category definitions, method hierarchy and the exclusion disclosures on categories 10, 13 and 14 |
| GHG Protocol Scope 2 Guidance | Dual reporting of market-based and location-based figures, and instrument criteria |
Restrictions on use
This report is prepared for the Audit and Risk Committee of Beckworth Group plc for the purpose of planning an assurance engagement. It is not an assurance report, it carries no conclusion on the FY2026 disclosures, and it should not be quoted in any public document. Our responsibilities are set out in the engagement letter dated 14 May 2026.
the report in figures
Sustainability assurance · London
CAL/BKW/2026-R2 · issued 11 September 2026
about this document
This is a specimen, produced by Enzwa to show how a technical assurance document can be structured, argued and set. Beckworth Group plc and Calderbrook Assurance LLP do not exist, no engagement took place, and every figure across these thirty-five pages is invented. The photographs are generated and show no real place, person or installation. The arithmetic is internally consistent throughout and the reporting standards named above are real ones.